
This guide explains every page of dbriq and how to use it day to day. If dbriq isn't installed yet, start with the Setup guide. Everything here also works on the built-in demo data, so you can follow along before adding a server.
Finding your way around
Every page is one click from the menu across the top, and red badges on the menu show how many items need attention there. In a narrow window the menu shows icons only. The dashboard refreshes every 15 seconds on its own.
| Menu item | Answers |
|---|---|
| Estate | Which databases need attention right now? |
| Advisor | What should I fix first, and how? |
| Response time | Where is the database time going, and on which queries? |
| Locks & deadlocks | Who is blocking whom, now and in the past? |
| Queries | What is running now, and which queries cost the most? |
| Health checks | What is at risk: backups, CHECKDB, availability, jobs, space, configuration, security? |
| Cost | Where am I paying for capacity I don't use? |
| Reports | Inventory, health, index and other reports to read, print or download |
| Compliance | Security audit and an auditor-ready report |
| Alerts | Everything that has fired, active and resolved |
| Servers | Add, edit, pause or remove servers |
| Settings | Collection, alerts, notifications, AI, access and users |
Search
Press Ctrl K (or /) anywhere, or click the search box at the top, and type part of a server, database or page name. Pick a result to jump straight to it.
Time ranges and time travel
Pages with charts have 1 h, 6 h, 24 h and 7 d buttons, and Custom for any period. Click any point on a chart to see what was running and who was blocking whom at that moment. Back to now returns to live data.
Changing the look
dbriq opens in the dbriq 2 look. To switch, open Settings > Appearance and choose dbriq 2, Classic dark, Classic light or Classic, match Windows. The choice is saved in your browser and changes nothing else.
Status colours
| Status | Meaning |
|---|---|
| Critical (red) | Something is failing or about to: act now |
| Warning (amber) | Outside normal limits: look at it today |
| Unreachable (red) | dbriq cannot connect to the server |
| Healthy (green) | Nothing found |
| Paused (grey) | Monitoring is switched off for this server |
Estate: your whole estate on one page
The Estate page lists every database, most urgent first, with its problem in words. Start each day here.
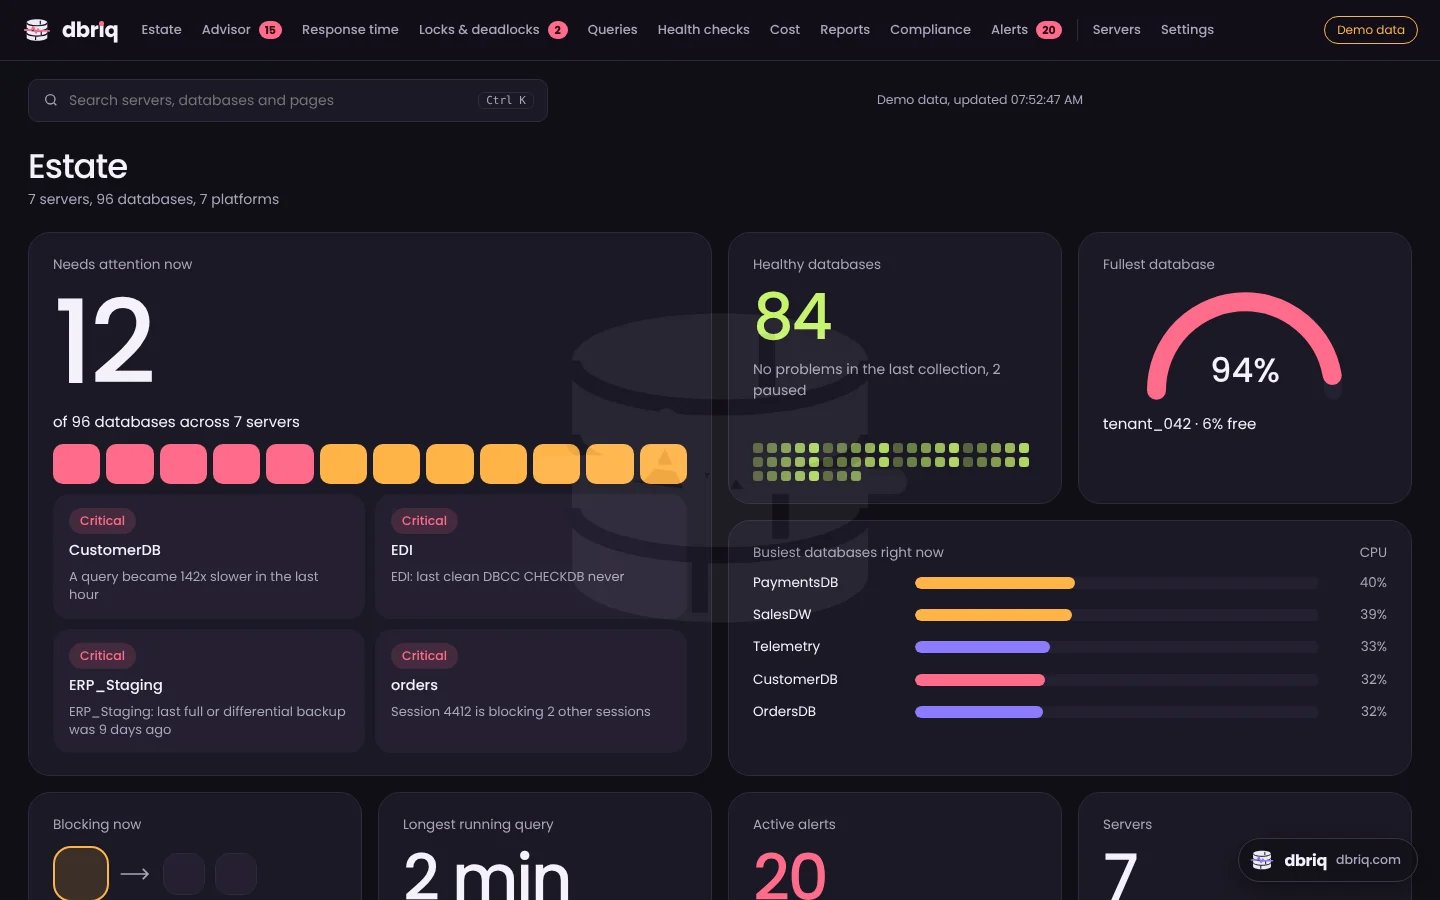
The page opens with a summary in tiles: how many databases need attention, with the four most urgent; healthy databases; the fullest database; the busiest databases by CPU; blocking now, with See the fix; the longest running query; active alerts; and servers. Click a tile to open what it shows.
Status cards below the tiles count databases that need attention, and split them into Critical, Warning, Unreachable, Healthy and Paused. Click a card to filter the list.
Views:
- Problems only shows just the databases that need attention.
- Group by server groups databases under their server. Each server row shows its platform, CPU, read latency, page life expectancy and batches per second, plus server-wide issues such as a failing Agent job or slow storage.
- Flat list shows every database in one sortable list.
Healthy databases are hidden until you click Show.
| Column | Shows |
|---|---|
| Status | Critical, Warning, Unreachable, Healthy or Paused |
| CPU | Current CPU with a one-hour trend line |
| Data IO, Log | Percentage of the data and log write limits in use (Azure SQL) |
| Sessions, Blocked | Open sessions, and how many are waiting on another session |
| Longest query | The longest-running query right now |
| Free space | Space left before the database or file is full |
| Top issue | The most important finding, in one line |
Click a column heading to sort, or a database name to open its page.
Database page: what is wrong and what to do
The database page explains each problem from cause to fix.
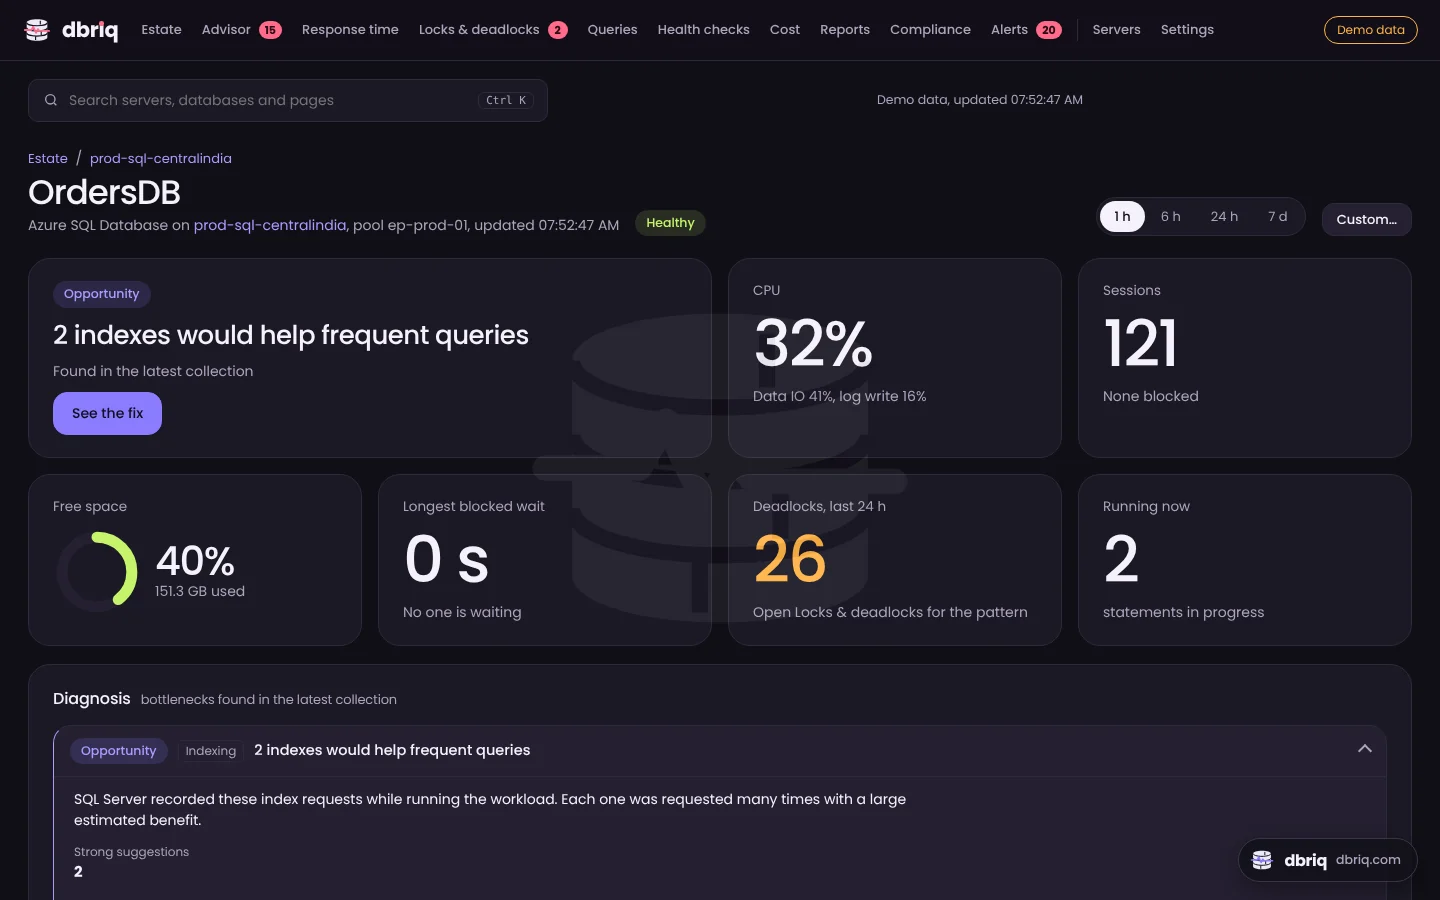
It has these sections, top to bottom:
- Summary tiles: the main problem with See the fix (it jumps to the diagnosis), CPU, sessions, free space, the longest blocked wait, deadlocks in the last 24 hours, and statements running now.
- Active alerts, each with Open and Acknowledge.
- Diagnosis: every bottleneck found in the latest collection. Each finding gives:
- a severity, a category (such as Blocking or CPU) and a one-line title;
- an explanation in plain words, with the key figures;
- the session or query causing it, with Copy query;
- What to do, including recent changes that may explain it, such as "Procedure dbo.usp_UpdateOrderStatus changed at 11:59";
- Fix scripts to copy. Review a script before running it; dbriq never runs scripts itself.
- Activity charts for CPU, IO, log, sessions and more. Dashed lines are the alert thresholds.
- Top waits: what the database spent its time waiting on.
- Index maintenance (SQL Server): fragmented indexes and when they were last checked.
Click a server name to open the server page, which shows server-wide waits, storage, memory and the server's databases.
Advisor: what to fix first
The Advisor collects every bottleneck across all servers into one list, ranked by impact. Use the filters All, Critical, Warning and Opportunities (improvements that are not urgent).
Each finding names the bottleneck (CPU, storage, log writes, memory, blocking or a plan regression), the queries behind it with their share of the load, why they are slow, and fix scripts to copy. With the AI assistant on, Explain with AI gives a longer explanation in context.
Response time: where the time goes
dbriq samples every active session every 2 seconds and classifies what it is doing: running on CPU, reading from disk, waiting for a lock, writing the log, and so on.
- Average active sessions by wait shows, over time, how many sessions were busy and on what. A tall band of lock waits at 10:15, for example, points straight at a blocking problem.
- Queries by time spent waiting lists the queries that used the most database time, and where their time went.
- Changes lists deployments and configuration changes as markers on the chart. Operators can click Add marker to record a release, and CI/CD pipelines can add markers with an API token.
Click any point on the chart to travel back to that moment.
Queries: what is running and what costs most
The Queries page has two tabs. Use the server and database filter at the top to narrow both.
Running now lists every active session: how long it has run, its status and wait, CPU, reads, the user, machine and application that ran it, and the statement. Filter by Minimum duration (over 10 s, 1 min or 5 min) or by user, machine, app or text. Sleeping sessions with an open transaction are shown too, because they often cause blocking.
Top queries ranks queries over a period by total CPU (SQL Server) or database time (PostgreSQL, MySQL), executions, duration or reads. Each row shows runs per minute, average duration and average reads, plan problems as tags, and Show full query and Copy. Click a query to see its history over time.
Execution plans
For SQL Server, click Execution plan on a query to open the plan explorer.
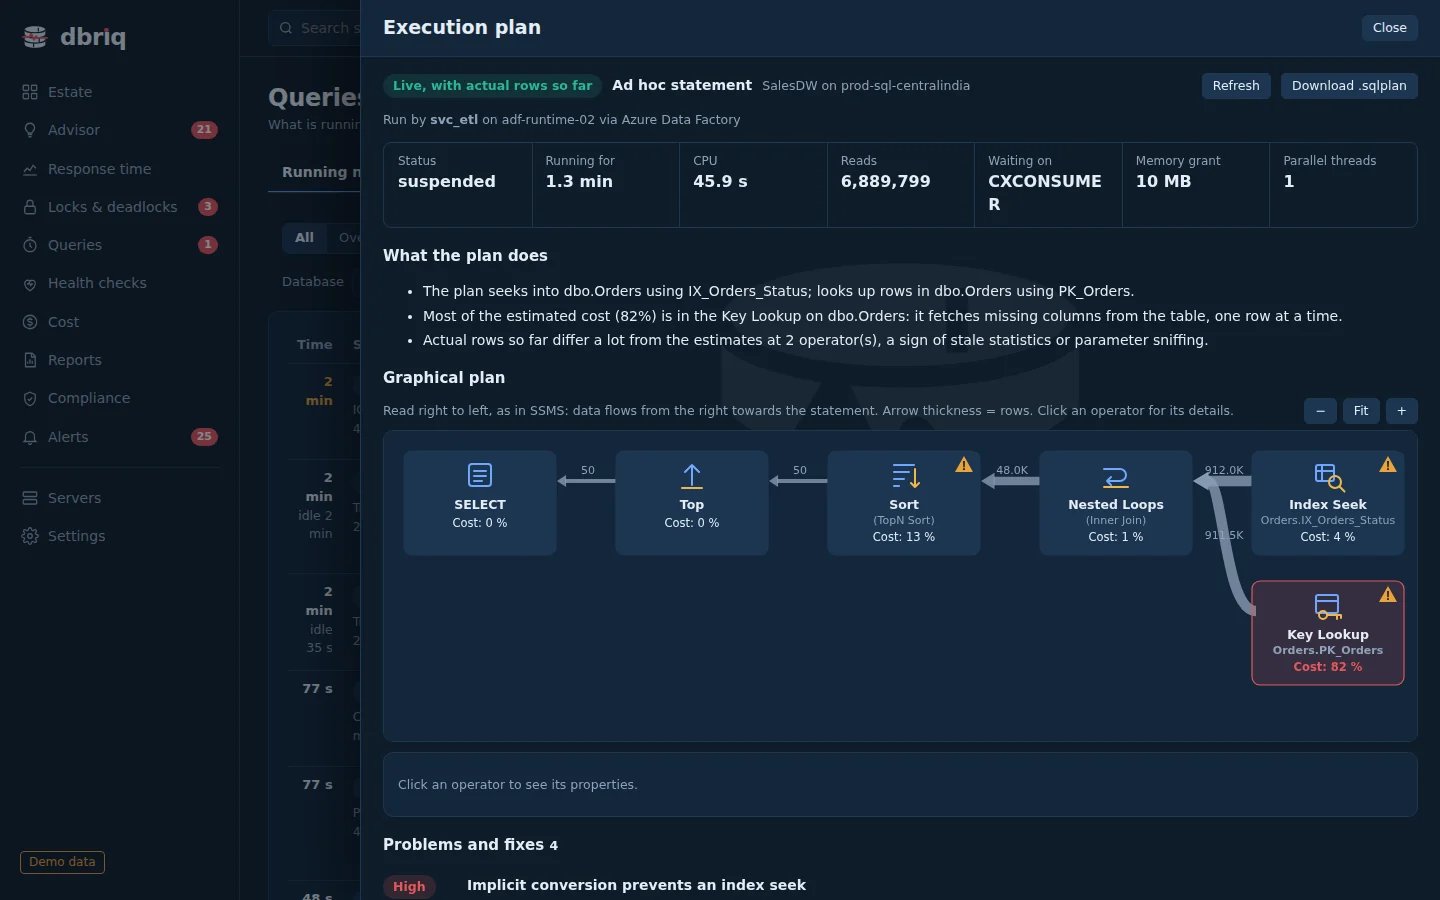
- Source: a live plan with actual rows so far (for a running query), or an estimated plan from the plan cache or Query Store.
- What the plan does: the plan explained in sentences, including where most of the cost is.
- Graphical plan: laid out like SSMS, read right to left. Arrow thickness shows rows; click an operator for its properties.
- Problems and fixes: issues such as key lookups, implicit conversions, spills or missing indexes, with severity and a fix.
Download .sqlplan saves the plan to open in SSMS.
Locks and deadlocks
This page shows live lock chains across every server, plus their history. It has three tabs.
Live blocking shows each database where sessions are waiting on another session: how many are blocked and the longest wait. For each chain you see:
- the head blocker (the session at the top that everyone waits for), with its user, machine, application and statement;
- Show blocking chain, which draws who waits for whom;
- Idle sessions with an open transaction, the most common cause: an application started a transaction and never committed it.
The database page's Diagnosis for the same problem includes what to do and a fix script.
Blocking history keeps past incidents: when each started, how long it lasted, the head blocker, how many sessions were blocked and the longest wait. Ongoing incidents are marked Ongoing. Filter by database, server, user, machine, application or statement, choose a Period, and click Show older incidents for more.
Deadlocks groups deadlocks with the same sessions, statements and objects into patterns, so one fix covers the whole group. Each pattern shows how many times it occurred, the victim, each session's statement and isolation level, What happened step by step, a Deadlock graph, and How to prevent it.
Setup: deadlock capture needs no setup on SQL Server, Managed Instance and Amazon RDS. On Azure SQL Database it needs the deadlock capture part of the setup script. PostgreSQL deadlocks are logged when
log_lock_waitsis on, as the PostgreSQL setup script recommends.
Health checks: what is at risk
Health checks find problems that are not slowing anything down yet but could cause an outage or data loss. They run every 10 minutes and are grouped into nine types:
| Check | Flags |
|---|---|
| Full and differential backups | Databases without a recent full or differential backup |
| Log backups | Log backups older than your recovery point objective (RPO) |
| DBCC CHECKDB | Databases not checked for corruption recently |
| Availability Groups and geo-replication | Unhealthy replicas, and lag above your limit |
| SQL Agent jobs | Failed jobs, and jobs running longer than your limit |
| Capacity forecasts | Databases, elastic pools, disks and Managed Instance storage that will fill up soon at the current growth rate |
| Configuration best practices | Settings that commonly cause problems, such as MAXDOP, cost threshold for parallelism, max server memory and tempdb files |
| Security | Too many sysadmin or superuser logins, risky options, missing encryption |
| Support lifecycle | Versions near or past their end-of-support date |
Set your own limits under Settings > Health checks:
- full or differential backup at least every N hours;
- log backup at least every N minutes (your RPO);
- CHECKDB at least every N days;
- replica lag allowed, in seconds;
- Agent jobs flagged when running longer than N hours;
- capacity warning and critical when full within N days;
- maximum number of sysadmin or superuser logins.
To silence a check for databases where it does not apply, add an exclusion such as */ReportServer* next to that check.
Cost: right-sizing
The Cost page compares what each cloud database or pool is sized for with what it actually uses, and suggests a change:
- Downsize: consistently using far less than it pays for;
- Add capacity: load is too high for its size;
- Idle: databases in elastic pools that do almost nothing;
- Right-sized: no change needed.
The totals at the top show Potential savings per month and per year, and Capacity to add where load is too high. The figures use example prices until you enter your contract rates under Settings > Cost rates.
Reports
The Reports page builds a report for one server or database when you open it. Choose the report tab, then the server (and database, where it applies) and the period.
| Report | Answers | Engines |
|---|---|---|
| Health report | What happened in the last 24 hours or 7 days: alerts, blocking, deadlocks and changes in order, load over time, where database time went, and problems right now. Built from dbriq's own history, so it adds no load to the server. | All |
| Indexes | Indexes nobody reads, indexes that duplicate each other, and indexes the optimizer asked for | All |
| Index usage by query | Which statements use each index, and how: seeks, scans, lookups and updates | SQL Server family |
| Parameter sniffing | Statements whose plan was compiled for an unrepresentative parameter value, checked against the column's histogram | SQL Server family |
| Application behaviour: Client timeouts | Statements the application gave up on, with the likely reason | SQL Server family |
| Application behaviour: Chatty statements | How often each statement runs against what each call costs; cheap statements that run constantly usually point to an application loop | All |
| Application behaviour: Connections | New logins per second, connection pooling and idle sessions, per application | All |
| Inventory | A complete record of a server or database: hardware, version, configuration, databases, files, security, jobs and availability | All |
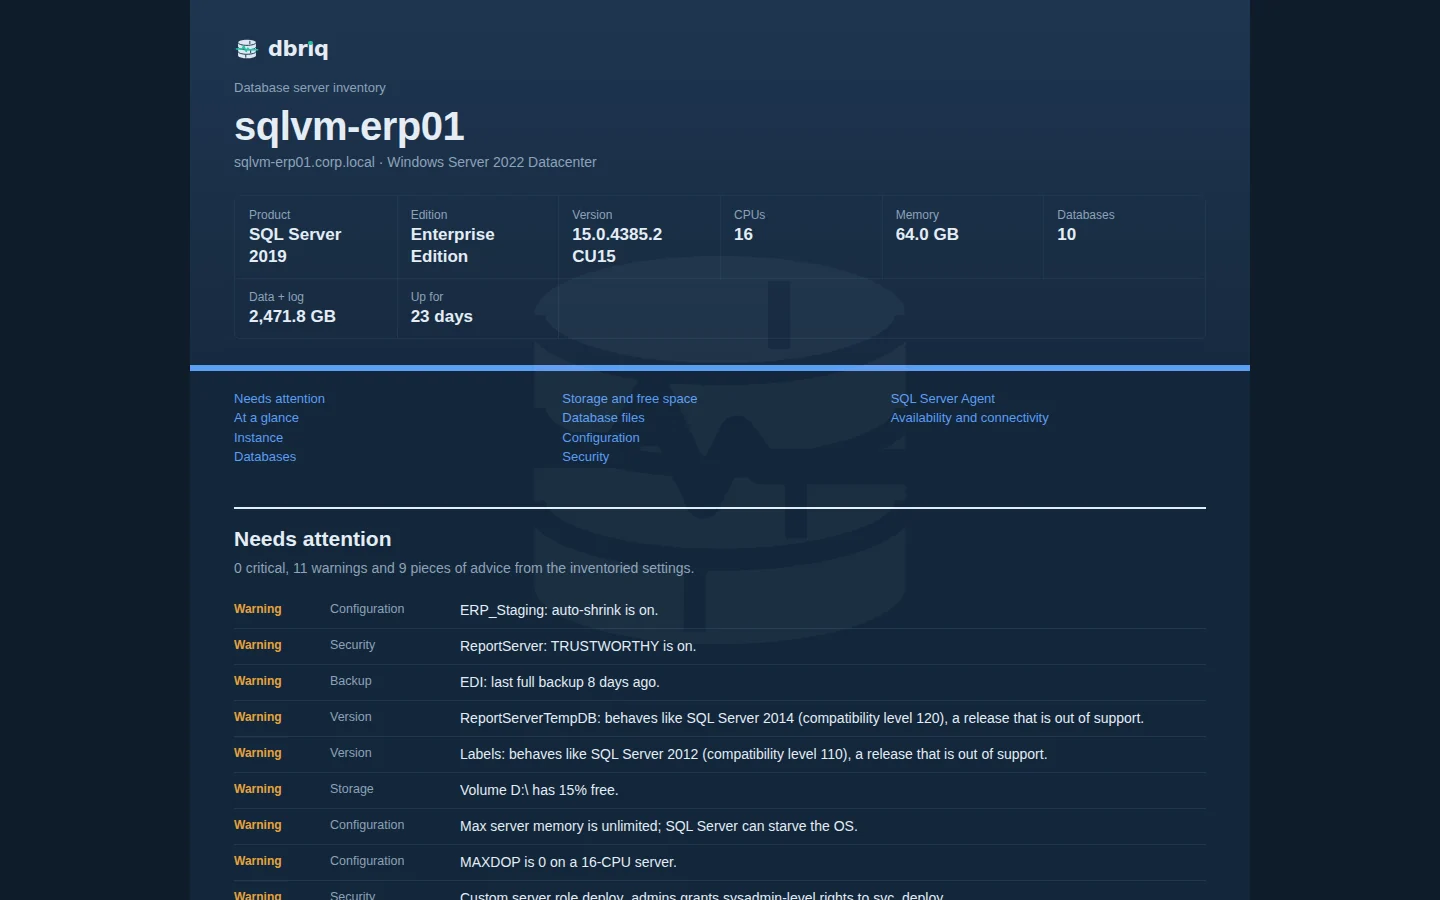
When a report is not available for a server, the page says so.
Downloading
- Download report (HTML) gives a single file with charts. Open it in a browser and print to PDF.
- Download workbook (Excel) gives one sheet per section, with filters, for a CMDB, asset register or your own analysis.
- The Inventory tab also offers All servers (Excel) and All servers (HTML report) for the whole estate at once.
Reports use short connections with a 5-second lock timeout and low deadlock priority, so they do not get in the way of production work.
Compliance
The Compliance page has two parts.
Security audit reviews each server's security settings: privileged logins and roles, encryption at rest (TDE) and in transit, risky configuration options, and audit logging. Click Run again after making changes.
Compliance report for auditors maps the findings to controls under five headings: access to data, data protection, secure configuration, audit logging, and operations and change management. It includes the evidence for each control and a sign-off block. Choose the scope and period, then download it as an HTML report (prints to PDF for the audit file) or an Excel workbook with sheets for the summary, controls and evidence, plus users and admin actions for admins.
Every download is recorded in dbriq's audit log. PostgreSQL and MySQL servers get the controls that apply to them: privileged roles, encryption in transit and connection logging.
Alerts
The Alerts page lists every alert dbriq has raised, with its state, what it was, when it was raised and how long it lasted. Filter with All, Active or Resolved.
- Acknowledge tells your team someone is on it. The alert stays active until the problem clears, but is marked Acknowledged. Acknowledge all active does every open alert at once.
- Alerts resolve by themselves when the condition clears; you don't close them by hand.
- Clear resolved tidies the list: clear the ones you tick, those resolved more than 24 hours ago, or those resolved more than 7 days ago. Active alerts are never cleared.
Where alerts come from
| Kind | Fires when |
|---|---|
| Threshold | A metric passes the limit you set under Settings > Alert thresholds, such as CPU above 90% |
| Anomaly | A metric is far above what is normal for that weekday and hour, such as "CPU is 85, against a normal 30 ± 8 for Mondays at 10:00" |
| Health | A health check fails, such as a missed log backup or a failed Agent job |
| Connection | dbriq cannot reach a server |
Alerts are sent to every notification route that matches the server and severity (see step 4 of the Setup guide). No new alerts or notifications are raised during maintenance windows.
Need help?
Email support@dbriq.com with what you saw and a screenshot. The Setup guide has a troubleshooting section for connection and data problems.